While

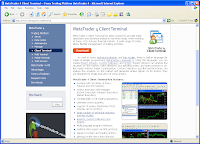
Marketiva has quite a few indicators on it, it may be a good idea to download Metatrader v4 from
Metaquotes. You can download a demo account here and there is an array of indicator on this software.A friend from Bandung, Indonesia (a mathematician and programmer by profession) shared with me quite a useful way to use a few indicators for us to have on our hands to be able to see the trend clearly. Maybe I can take you on a step by step tour of his method;
Once you have download Metaquotes4 you can install it on your PC and get it up and running. Its quite easy as long as you follow the steps.

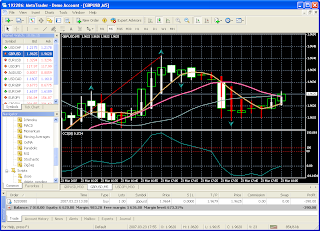
Lets get started, get the MT4 up and running, lets use GBP/USD to start with. You will see something like the screen on the right>>> Start with M30 chart, the 30 minutes chart.
1.Open
Custom indicator, use
zig zag (navigator/custom indicator) indi and set input to 21, 9 , 4 (
ctrl L and double click on
zig zag, to change numbers, go to INPUT and double click the value)
2.Next open Custom indicator, apply heiken ashi double click, then OK. Heiken Ashi is used to reduce 'noise' and give a clearer picture of the graph.
look at zi zag and the colour made by heiken... got some idea?
3.Go to INDICATORS and apply SMA 5, 10 and 20. click on indicators and click
trend.. there is
moving average. make three sma change to 5, 10 and 20 on the parameter. Change to 5 the first MA.. and make another MA set 10 and make the last MA set it to 20. Now look at the zigzag... 5 & 10 always crossing there
4. Much better if you add
fractals.., at
Bill Williams indikator and playing at

5 minutes .., maybe you can get small little pips in short time. (INDICATOR/BILL WILLIAMS/FRACTAL)
5. Next on
Custom indicator, use
cci .... at INPUT, CCI period, set it to 20. Click on LEVEL and add level, 100, 80, -80, -100.
The trend line at CCI will cross level 80/100 and -100/-80 when the price trend go up & down
. SUMMARY: if line go up... pass 100/80, close BUY, open for SELL, if line go down... pass -100/80 close SELL open for BUY

but remember: check other indi too
REMINDER: don't take new buy position if cci cross level 200.. that's overbought area
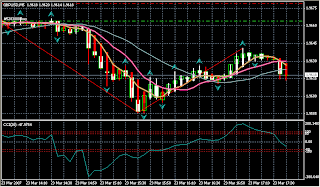
EXAMPE: See 2nd from bottom graph, zig zag reach bottom at 1.9585 check also at CCI at that point it is moving up from below to -80/-100 line. After that the zigzag line went up showing upward trend until it reach just under 1.9645. The CCI looks like losing steam at that point and after that it went down.
You can see a close up view on the bottom picture. Zigzag line (in red) goes maximum at under 1.9645 and after that as confirm by CCI, it went on downhill.
The above are just some indi being used and I recommend it for newbies (people like me who need guidance but in simple not too detailed methods.
Have fun :)
 Start Trading Forex With as Little as $1 at Marketiva.


